
- Tools
- Creators
- Resources


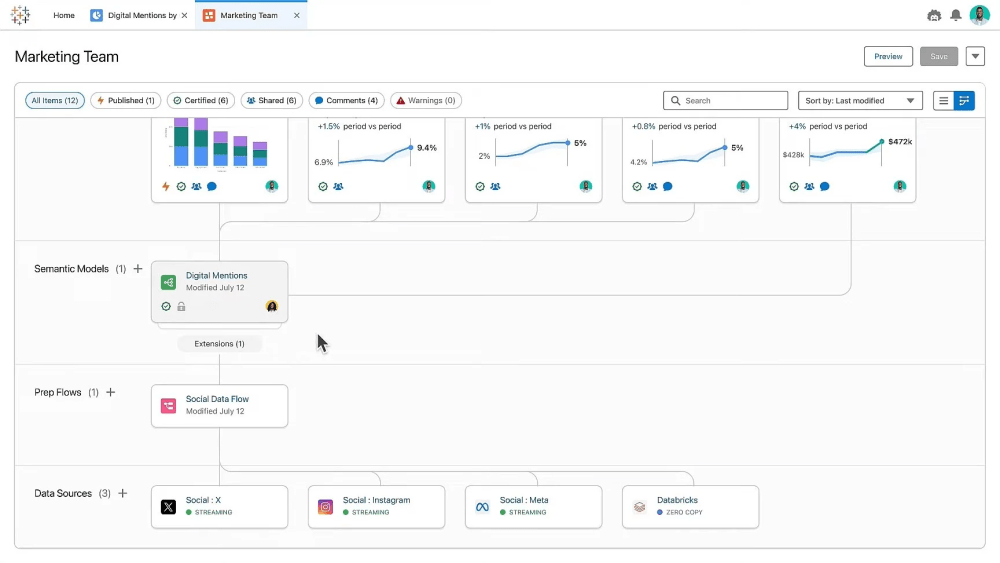
Tableau is a dynamic visual analytics platform that transforms complex data into intuitive, interactive dashboards and visualizations. Designed for businesses seeking powerful insights, it enables users to connect diverse data sources, explore information through drag-and-drop interfaces, and create compelling graphics without extensive programming skills. Its user-friendly approach helps teams quickly understand data patterns and make informed strategic decisions.
Tableau excels in advanced data visualization, offering a powerful platform for exploring complex datasets. Its intuitive drag-and-drop interface, live query capabilities, and broad integration options make in-depth analysis accessible. Conversely, this power comes at a usability cost. The interface can feel cluttered, and some features are buried in menus, making it less approachable than competitors like Power BI. Organizations needing robust visualizations for complex data will find Tableau valuable. If your needs are simpler or your team lacks technical expertise, consider alternatives. Startups focused on rapid prototyping might find its depth excessive, while established enterprises dealing with large datasets should explore its potential.
Tableau is a strong choice for the right user, but its complexity isn't for everyone. If you’re prepared to invest the time to master its intricacies, Tableau’s visualization power can unlock valuable insights. If ease of use is paramount, look elsewhere.
To identify key business drivers and improve decision-making, connect multiple data sources like sales data, marketing analytics, and web traffic metrics within Tableau. By creating a blended data source, you can visualize relationships between these datasets in a single dashboard. For example, overlay website traffic spikes with corresponding marketing campaign data and sales figures on a timeline to pinpoint which campaigns are most effectively driving conversions and revenue growth, allowing you to focus future efforts on high-impact strategies.


